Insight · Investment view
Liquidity drives markets: a lens, not a law
The macro framework behind the whole portfolio — why liquidity sits underneath every position, how rates influence its flow, and what the record from 2025–2026 taught me about where the framework works — and where it doesn't.

Ask me why I own any individual stock and you’ll get a company answer — a thesis, a moat, a risk. Ask me why the whole portfolio is shaped the way it is — growth-heavy, concentrated in businesses whose value sits years ahead, comfortable holding through noise — and the honest answer has always been one word: liquidity.
That word sits underneath almost every macro post I’ve written. It’s the reason my weekly notes track bond yields and money supply more closely than headlines. And in July 2025, in the post welcoming a wave of new copiers, I wrote the whole framework down in one place:
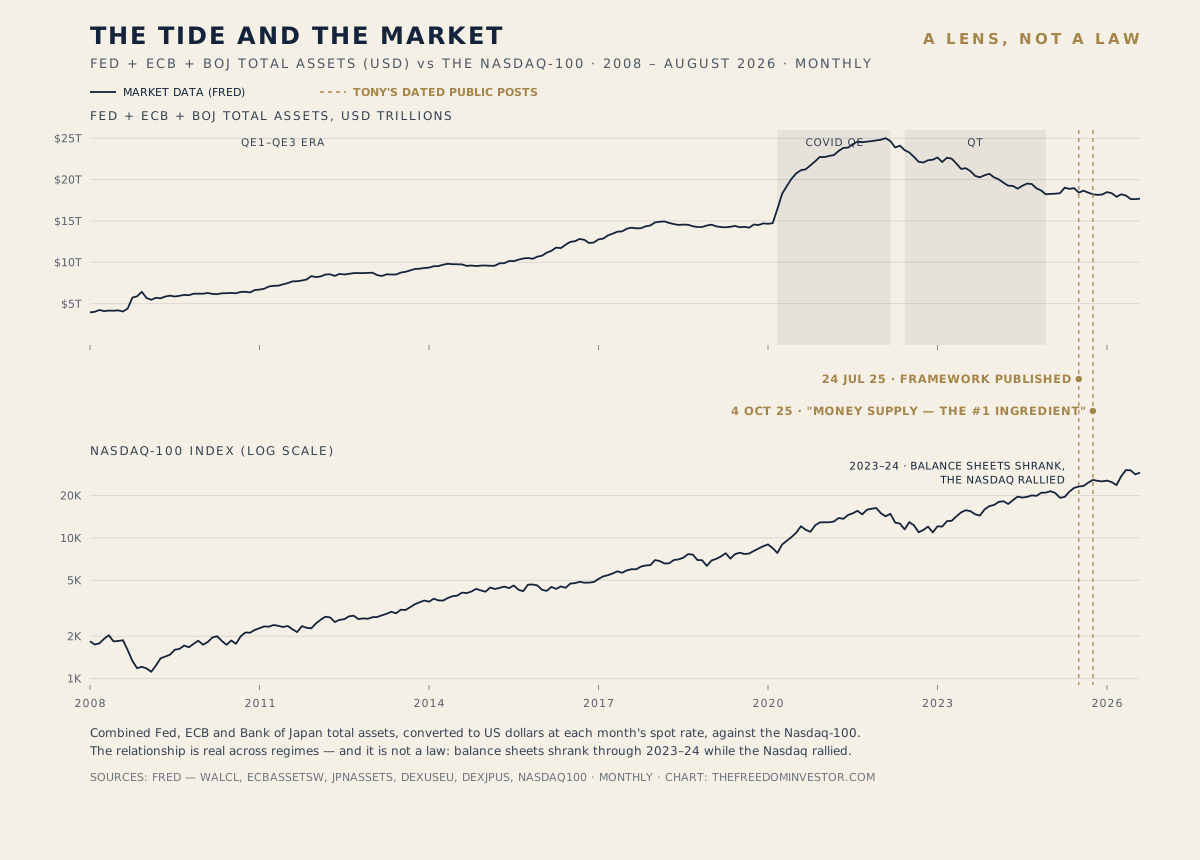
24 JULY 2025 · FROM THE PUBLIC RECORD “The U.S. has over $8 trillion in debt maturing this year, and that needs to be rolled over. The optimal way to do that? Lower interest rates… my core belief is that liquidity drives markets. In fact, the Nasdaq has shown a ~97% correlation to global liquidity. So if rates come down → liquidity rises → growth stocks surge. We’re already well positioned for this.”
This article does two things with that paragraph. It explains the lens properly — because I still use it, and it has earned its place. And it audits the paragraph itself, because parts of it deserve a harder look than I gave them at the time. One number in there I’ve quietly stopped using, and I’d rather retire it loudly.
The lens
The idea is simple enough to state in three steps. Money that can be invested — call it liquidity — expands and contracts, mostly with central-bank policy, credit conditions and government financing needs. When it expands, it has to go somewhere, and it goes furthest into the assets whose value lives in the distant future: growth companies, technology, everything priced off cash flows years away. When it contracts, those same assets fall hardest, for the same mathematical reason in reverse.
When I say liquidity, I mean the quantity of money in the financial system — the thing central banks create and destroy. The cleanest picture of it is their balance sheets: when the Fed, the ECB or the Bank of Japan buys assets, new money enters the system — that’s QE, or as I put it in one post, “the Fed can fire up the money printer anytime.” When they let those holdings run off, money drains back out. Money supply tells the same story from the other side of the ledger. “Liquidity is the market’s oxygen,” I wrote in September 2025, “and the Fed controls how much of it we all get to breathe.”
Interest rates are not the definition — they are the price of money, and the most important tap on its flow. Cheaper money means companies borrow and invest more easily, bond yields stop competing with equities for capital, and — the part that matters most for a portfolio like mine — the discount applied to future profits shrinks, which mechanically raises what long-duration businesses are worth today. That’s why my weekly notes obsess over rates: not because rates are the framework, but because they’re the fastest-moving signal of which way the tide is turning.
There was also, in 2025, a structural backdrop that gave the direction of rates unusual weight. The US had an enormous wall of debt to refinance — I wrote “over $8 trillion”; the figure documented since is about $9.2 trillion, roughly a third of the entire Treasury market rolling over in a single year. My shorthand at the time was that a government refinancing on that scale would welcome cheaper money. I’d put it more carefully today: the Fed sets rates from its own mandate, and when the cuts came, they came for the Fed’s stated reasons — a weakening labour market — not for the Treasury’s calendar. What the refinancing wall really told me was something simpler: with that much debt rolling over, every move in rates carried enormous consequences, which is exactly why the cost of money was the variable everything else would be priced against.
So the framework said: the direction of travel is easier policy, easier policy is liquidity, and liquidity finds growth. I built the portfolio accordingly and said so in advance.
The audit
Now the number I owe you.
“The Nasdaq has shown a ~97% correlation to global liquidity.” I used that statistic three times in the second half of 2025, and the first thing to say about it is that its context was right: it’s a claim about the quantity of money, not about interest rates. It appears to trace to the global-liquidity research popularised by Raoul Pal and Global Macro Investor — work comparing the Nasdaq to measures of the money in the system, built from central-bank balance sheets and global money supply. The same tide this article is about. I also remember running a version of the numbers myself at some point and getting an R² in that neighbourhood — though I no longer have the calculation, and an R² isn’t the same claim as a correlation.
And that’s exactly the problem: I can’t verify the figure to the standard I want to hold myself to. The index behind the headline number is proprietary, the window and method unpublished, and there’s a subtler trap — two series that both mostly rise will always show a spectacular correlation, whether or not one drives the other. Liquidity and the Nasdaq both went up for fifteen years. So did global population. For what it’s worth, the narrower version I can rebuild from public data — Fed, ECB and Bank of Japan balance sheets in dollars against the Nasdaq, 2008 to 2026, the chart on this page — correlates at about 0.78 on monthly levels and near zero on year-over-year growth rates. The direction shows up. The precision doesn’t.
None of that makes the lens wrong — the mechanism runs through money creation, capital flows and discount rates, not through a scatter plot. But a number that precise, doing that much rhetorical work, deserved more scepticism than I gave it. If you look at my posts from 2026, you’ll notice the statistic simply disappears. This paragraph is the honest version of that disappearance: the direction is evidence; the decimal places were decoration. I keep the lens. I retire the slogan.
The lens at work — and under stress
A framework only means something if it’s on the record doing things. Here is what this one did, dated.
In the second half of 2025, the tide’s direction hung on the Fed’s tap, so this stretch of the story runs through rates. Through late summer the framework kept me fully positioned in growth while inflation cooled, and it made the call that mattered: in September I wrote that a rate cut was coming the following week. It came — the first of three straight cuts that took the Fed to 3.50–3.75% by December. What did not come was my “dream scenario” of a surprise 50-point cut, which I’d floated in August. The easing cycle arrived; the fireworks I hoped for didn’t. Direction right, drama wrong.
And between the cuts, the quantity side kept score on its own:
4 OCTOBER 2025 · FROM THE PUBLIC RECORD “We’re seeing sustained money supply growth, which historically has been the #1 ingredient for bull markets. Even without official rate cuts, liquidity is quietly rising — and markets are front-running the next phase.”
That post is the framework in its own terms: the cuts were the tap, but the money itself was always the measure.
Then November arrived and stress-tested everything. The market’s confidence in a December cut faded, “higher for longer” was suddenly back in every headline, and my portfolio had its ugliest stretch of the year — down around nine percent mid-month by my own running count. Here is what the lens did not do: it did not warn me about November. It has no timing in it. A liquidity framework tells you what regime you’re in; it tells you nothing about which week the regime gets doubted. I wrote in September that the next few years were “setting up to be beautiful,” and six weeks later I was explaining a drawdown. Both posts are still up.
What the lens did do was tell me what to watch for at the bottom. And in December, it happened exactly through the framework’s own channel:
21 DECEMBER 2025 · FROM THE PUBLIC RECORD “The shift came in the final two trading days. Bond yields finally rolled over, which immediately took pressure off equities… Once yields stopped rising, rate-cut expectations firmed up again. That was enough to flip the switch… liquidity moved first — long before certainty returned.”
That last line is the entire framework in seven words. Prices didn’t wait for the news to feel better; they moved when the money moved. If you only remember one sentence from this page, that’s the one — with its warning attached: liquidity moves first, and it doesn’t send a calendar invite.
February 2026 supplied the other side of the ledger, in case I was tempted to think the maths only worked in my favour. Software stocks were crushed in one fast, emotional week — the trigger was fear that AI tools would disrupt their business models, but as I wrote at the time, higher bond yields added pressure of their own: these are businesses priced almost entirely off profits years away, and when yields rise, their multiples compress quickly even if nothing about the business has changed. The same arithmetic that had flattered my holdings on the way up was working in reverse. A lens that explains your gains also explains your losses. If it doesn’t, it isn’t a lens; it’s a story.
How the framework has aged
Read my 2025 posts and the framework sounds like a tide: cuts are coming, liquidity will rise, markets will rip. Read the 2026 ones and the language has changed. Inflation re-accelerated, the cuts stopped, and yet the structural bid for AI and innovation didn’t break — it narrowed. By May 2026 I was writing it this way:
4 MAY 2026 · FROM THE PUBLIC RECORD “Higher rates are not killing this cycle. They’re filtering it. Markets are rewarding companies with genuine exposure to compute, infrastructure and enterprise demand — not just the ones with AI in their press releases.”
That’s not a retreat from the framework; it’s the framework growing up. The 2025 version said liquidity lifts the boats. The 2026 version adds: and when liquidity is rationed, it chooses which boats — the ones with real earnings, real balance sheets, real monetisation. Tide when it’s flowing, filter when it isn’t. The constant is that I’m always asking the same first question about any market move: what is the money doing? — before I ask what the headlines are saying.
What the lens is not
Three boundaries, learned the way boundaries usually are.
It is not a timing tool. It told me 2025’s direction and sat silent through the worst month of my year. It sets posture — how much risk the portfolio carries, how far into the future its bets reach — never entries and exits.
It is not a law. I’ve watched it get overridden by things that have nothing to do with money supply: a tariff announcement erased more than a tenth of the market’s value in two sessions. When politics, war or panic take the wheel, the lens waits.
And it is not a slogan. That’s the 97% lesson. The moment a framework compresses into a number you repeat instead of a mechanism you check, it has stopped being analysis. The mechanism — central banks set the money, money seeks the future, and the future is where my portfolio lives — I’ll defend all day. The decoration I’ve given back.
Liquidity drives markets. I believe that as much as I did in July 2025 — I just hold it the way it deserves to be held: as the reason my portfolio looks the way it does, never as a promise about what next month brings. The record of what that’s produced, Novembers included, is public.
Dated excerpts and quoted lines above are from my public eToro feed, May 2025 – May 2026. Fed policy dates, the Treasury refinancing figure and the balance-sheet data are from primary sources; portfolio figures are as I stated them at the time, correct as of late August 2026.