From the public record · September–November 2025
The Bitcoin halving clock: a documented cycle trade
In September 2025 I put 10% of the portfolio into Bitcoin with a target, an expiry date and a label written before entry. The trade made roughly nothing — and preparing this article uncovered an arithmetic error my own rules quietly paid for.

Originally shared on Tony's eToro feed · 29 September 2025 · view the original post
In September 2025 I put ten percent of my portfolio into Bitcoin because of a clock.
Not a view on adoption, not a belief in digital gold — a clock. A pattern in the calendar said this cycle was due to top, I wrote down a target and an expiry date before I entered, and three weeks later I was out with roughly nothing to show for it.
I still think it’s one of the most instructive trades I’ve ever put on. Partly because every step of it is dated and public. And partly because, while preparing this article, I re-ran my own arithmetic and found a mistake I didn’t know I’d made — one my rules quietly paid for.
Let me show you the whole thing, in order.
Where crypto sits for me
Some context first, because it matters for what follows. I’m not a crypto investor by temperament. My portfolio is technology businesses — companies with products, revenue and management I can evaluate. I had exited all of my crypto in March 2025 to buy Tesla and Palantir during the tariff selloff, and in July I closed most of an Ethereum position at a profit because a rally looked wrong to me.
So when crypto shows up in my portfolio, it is always the same thing: a trade, sized and labelled as one. That label — written at entry, not discovered at exit — is the spine of this story.
The pattern
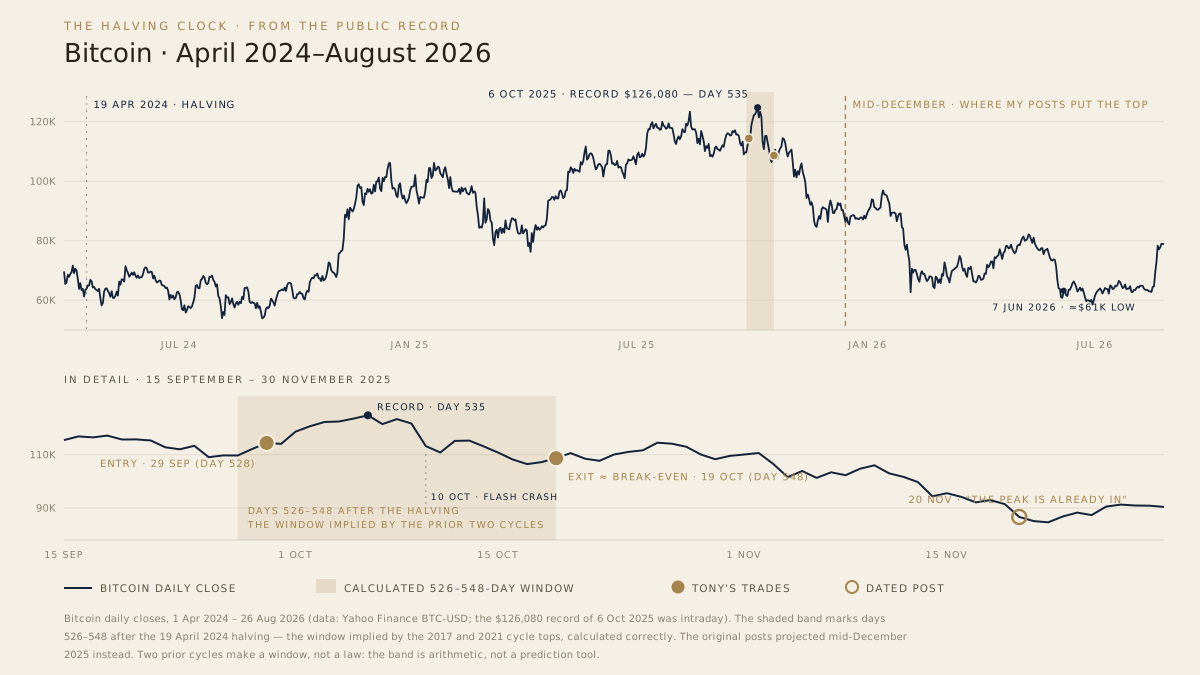
Bitcoin’s supply schedule halves roughly every four years, and the two completed cycles before 2025 had something odd in common. After the 2016 halving, the cycle topped 526 days later, in December 2017. After the 2020 halving, the next cycle topped 548 days later, in November 2021. Two cycles, tops twenty-two days apart on the halving clock.
Two data points. I want to be honest about how thin that is — two intervals is a coincidence with good posture, not a law of nature. I knew that at the time, and it’s why what follows was structured the way it was.
29 SEPTEMBER 2025 · FROM THE PUBLIC RECORD “2017: the ultimate cycle top came 526 days after halving. 2020: the top came 548 days after halving… I’m positioning for this final pump. Target: $150K Bitcoin. Exit plan: either at price target OR mid-December — whichever comes first. ⚠️ This is a short-term, event-driven trade — not a long-term conviction hold. Markets don’t repeat exactly, but they often rhyme.”
Everything that matters about this trade is in that post, written before the outcome. A thesis. A target. A time limit. And a label: trade, not conviction.
The rules
The entry wasn’t clean, and I’ll keep that in the record too. Three days earlier I’d posted that I was “most likely loading if it drops to $105K by Sunday.” The market never offered $105K. I paid up at around $109K instead — a small tell, in hindsight, about how keen I was.
The position was funded by closing four stocks that weren’t doing anything — roughly break-even between them — which is how I think about every new position: not “do I have cash?” but “what is this capital doing now, and could it work harder somewhere else?” I added on 1 October to bring Bitcoin to about ten percent of the portfolio, with trailing stops underneath.
Ten percent is a deliberate number. It’s enough to matter if the thesis works. It’s small enough that if the thesis is nonsense — and a two-observation pattern might well be — the damage is a bad month, not a bad year. The size of a position should reflect the strength of the evidence behind it, and two data points do not buy a large position, whatever the chart looks like.
For a week, it worked beautifully.
4 OCTOBER 2025 · FROM THE PUBLIC RECORD “Our Bitcoin position is now up +10% in just a week… Sometimes I really do wonder if I’ve got a crystal ball 🔮😂. But this wasn’t luck — it was based on the Bitcoin halving cycle… If that pattern continues, we’re looking at a potential peak around mid-December 2025.”
Two days after that post, on Monday 6 October, Bitcoin printed a record high around $126,000 — and never saw it again.
Four days after that, it fell off a cliff. On Friday 10 October, the White House unexpectedly announced an additional 100% tariff on Chinese imports, and crypto had the largest wave of forced liquidations in its history: roughly nineteen billion dollars of leveraged positions closed out in about a day, Bitcoin down fourteen percent in hours. I did not see it coming. What decided who survived that day wasn’t foresight — it was leverage. I had none, and the position was ten percent of a portfolio, not a lifestyle. The crystal-ball joke aged badly within the week, and I’ve tried not to make it since.
The exit
Over the following week Bitcoin bounced, faded, and then did two things my trade couldn’t ignore: it failed to get anywhere near reclaiming the high, and it broke below its 200-day moving average on heavy volume.
19 OCTOBER 2025 · FROM THE PUBLIC RECORD “Bitcoin had its chance about two weeks ago to break out above its all-time high and push into the $150K+ range — but it failed miserably… Then it broke below the 200-day moving average on high volume… The strong buyers are gone (for now). From here, it’s basically a 50/50 toss-up whether it recovers or breaks lower — and I don’t trade on luck.”
I closed the rest of the position that weekend. With the partial profit I’d taken at $112K on the way up and the remainder out at $107K, the whole trade finished roughly flat against a ~$109K entry.
Notice what actually ended it. Not the price target — never reached. Not the calendar — mid-December was still eight weeks away. A third condition fired first: the thesis was invalidated by the tape. A trade that only has a bullish exit and a date is a trade that can strand you; the exit that saved this one was the one that asked, every day, “is the reason I’m here still true?” When the answer became “coin flip,” the label on the trade made the decision for me. Trades don’t get benefit of the doubt. Investments earn it; trades never do.
Within two days the capital was working somewhere else.
Calling it out loud
A month later, with Bitcoin under $90,000 and most of the market debating whether this was a dip to buy, I posted the arithmetic that had been bothering me.
20 NOVEMBER 2025 · FROM THE PUBLIC RECORD “I know a lot of crypto enthusiasts won’t like this post… but data is data. 2017 peak: 526 days after halving. 2020 peak: 548 days. 2025 peak: 6 October — 535 days after the 2024 halving. Three completely separate cycles… all landing inside a 22-day window… I’m leaning toward the idea that the cycle might’ve already topped.”
That was an uncomfortable thing to publish. The prevailing argument was that this time was different — the institutions had arrived, the ETFs had arrived, the old cycle was dead. My view was that the “this time is different” story had been priced in on the way to $100K, and the clock said the top was in. I wasn’t sitting safely on the sidelines being clever after the fact; I’d already walked away at break-even a month earlier, and this post was me explaining why I wasn’t coming back.
What we know now
As of 26 August 2026 — ten months later — Bitcoin has never reclaimed that 6 October high. It spent 2026 grinding lower, touched roughly $61,000 in June — about half the peak — and trades near $79,000 as I finalise this article. The exit I was mildly annoyed about at the time, the one that made approximately nothing, avoided a decline that at its June low reached about forty percent below my exit price. I haven’t owned crypto since.
So the clock was right? Careful. This is where I have to be honest about something I only found while writing this article.
Go back to the numbers in my own posts: tops at 526 and 548 days after the two previous halvings. The 2024 halving was on 19 April. Add 526 to 548 days to that date and you get a projected topping window of 27 September to 19 October 2025. That is what my own cited pattern actually implied. Yet my posts — twice — projected the top for “mid-December 2025.” Somewhere between the data and the keyboard, I anchored the count on the wrong starting point, and I repeated the error with confidence. (My best guess at the mechanism, and it is only a guess: the 2016 halving was in July, and July 2024 plus 526 days lands in mid-December 2025 almost exactly. I suspect I counted from the wrong halving.)
Here is what that means. I entered the trade on 29 September — day 528 of the cycle, two days inside the window my own numbers defined. By my own thesis, done properly, I wasn’t positioning ahead of a final pump; I was buying into the top window itself. The top came on 6 October — day 535, squarely inside that window, five trading days after my entry. And my exit on 19 October fell on day 548 — the window’s final day — triggered not by the calendar I’d miscalculated but by the invalidation rule that didn’t care whose fault anything was.
The pattern turned out better than my application of it. The trade survived anyway — not because I was right, but because nothing about the structure required me to be. Sizing capped the cost of being wrong. The label stopped me from arguing with the tape. The invalidation exit fired on evidence while my projected date was still quietly wrong in both directions.
What this trade actually taught me
The tempting summary is “the halving clock works — three tops in a 22-day window.” I’d resist that. Three points is still three points, I managed to misread the clock even while betting on it, and if Bitcoin had melted up to $150K in November, this article would be about a pattern that failed. Patterns in markets are hypotheses to be bet against a budget, not truths to be believed.
What I actually keep from this trade:
Write every exit before the entry. This trade had three ways out — a target, a date, and an invalidation — and it was the one I treated as boilerplate that ended up mattering. The two exits I was excited about never fired.
Size to the evidence, not the excitement. Two data points bought a ten-percent trade with stops. The same conviction feeling, unexamined, buys people their whole portfolio.
Label the position at birth. “Short-term, event-driven, not a conviction hold” was written on day one, when it cost nothing to write. Three weeks later that sentence is what made selling at break-even easy instead of agonising. Positions that lose their label are how trades quietly become investments — usually at the exact moment they start losing.
Break-even can be a result. Measured against the entry, this trade made nothing. Measured against what the same capital avoided and what it did next, it was one of my better decisions that quarter. The ledger you grade yourself on matters.
And one more, newer than the rest: audit your own arithmetic, especially when the trade worked out. The comfortable version of this story — disciplined entry, clean exit, top called in public — survived intact for ten months because nothing forced me to recheck the maths. Writing it down for the record did. The process protected me from an error I didn’t know I’d made, which is the whole point of process: it has to work on the days your reasoning doesn’t.
The same sizing discipline that let me buy the April 2025 crash is what let me walk away from this trade — the two decisions look opposite, buying into fear and selling into hope, but they come from the one rule: no single position, and no single mistake, is ever allowed to matter too much. My track record carries what that compounds into.
I don’t know when I’ll own Bitcoin again. If I do, it will arrive the way this one did — with a size, a label, and its exits written first. And this time, I’ll check the calendar twice.
Every dated excerpt above is quoted or faithfully condensed from my public eToro feed, September–November 2025. The arithmetic error described was found while preparing this article and is preserved exactly as it happened. Nothing has been edited to improve the record.